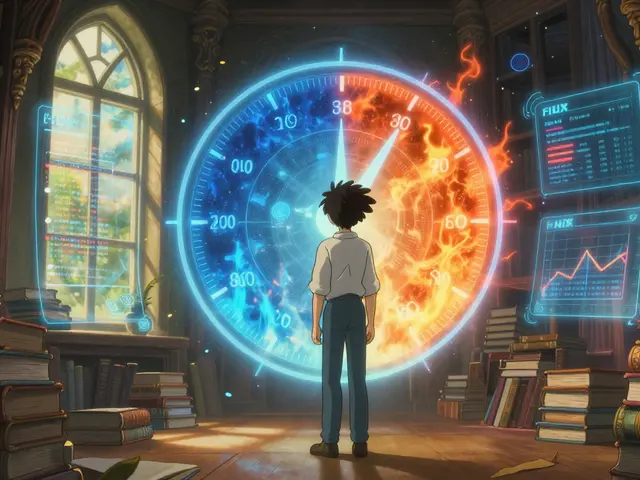
Have you ever felt the urge to sell everything because the news sounds terrifying? Or maybe you bought at the top because everyone else was making money and you didn't want to miss out? You are not alone. These feelings drive the market. The Fear and Greed Index is a tool that measures exactly this emotional temperature. It doesn't tell you what to buy or sell directly. Instead, it tells you how other investors are feeling right now.
Developed by CNN Business in 2012, this index has become a staple for traders and long-term investors alike. But here is the catch: most people use it wrong. They treat it like a crystal ball rather than a thermometer. If you understand how it works, you can spot opportunities when others are panicking. If you ignore its limits, you might get burned. Let’s break down how to read it, where it comes from, and how to actually use it in your strategy without losing your shirt.
What Is the Fear and Greed Index?
At its core, the Fear and Greed Index is a quantitative measure of market sentiment. It assigns a number between 0 and 100 to the collective mood of investors. A score of 0 means "extreme fear," while 100 means "extreme greed." A score around 50 indicates neutral sentiment.
The logic behind it is simple but powerful. Markets are driven by human psychology. When everyone is scared, they sell assets cheaply, often below their true value. This creates buying opportunities. When everyone is greedy, they buy assets at inflated prices, creating potential risks for new buyers. As Benjamin Franklin famously said, "Buy when there is blood in the streets." The index helps you identify those moments.
Who created the Fear and Greed Index?
CNN Business (formerly CNN Money) developed the original index in 2012 to track stock market sentiment.
How the Stock Market Version Is Calculated
You might wonder how emotions are turned into a number. The answer lies in data. The stock market version of the index uses seven specific indicators. Each indicator is normalized to a 0-100 scale and then averaged equally. Here is what goes into the mix:
- Stock Price Momentum: Compares the S&P 500's current price to its 125-day moving average. Big jumps up signal greed; big drops signal fear.
- Stock Price Strength: Looks at how many stocks hit 52-week highs versus lows. More highs mean greed.
- Stock Price Breadth: Measures the volume of advancing shares vs. declining shares. High volume in rising stocks suggests strong bullish sentiment.
- Put/Call Ratio: Puts are bets on prices falling; calls are bets on prices rising. A high ratio of puts indicates fear.
- Junk Bond Demand: Tracks the yield spread between risky corporate bonds and safe Treasury bonds. Narrow spreads suggest investors are taking risks (greed).
- Market Volatility (VIX): Known as the "fear gauge," high VIX readings indicate uncertainty and fear.
- Safe Haven Demand: Compares stock performance to Treasury bonds. If bonds outperform significantly, investors are fleeing to safety (fear).
This methodology hasn’t changed much since 2012. While some critics argue it needs updating for modern algorithmic trading, it remains a robust snapshot of traditional equity markets.
The Crypto Fear and Greed Index: A Different Beast
If you trade Bitcoin or Ethereum, the CNN index won't help you much. That’s why alternative.me launched the Crypto Fear and Greed Index in 2018. This version focuses specifically on cryptocurrency markets, which move faster and are driven by different factors than stocks.
The calculation is simpler and more focused on digital asset dynamics:
- Volatility (25%): Analyzes recent price swings compared to historical averages.
- Momentum/Volume (25%): Looks at trading volume and price trends over the last week.
- Social Media (15%): Scrapes Twitter, Reddit, and Google Trends for mentions of Bitcoin and major altcoins.
- Dominance (10%): Checks if Bitcoin is gaining or losing share relative to other cryptocurrencies.
Note that the crypto index currently relies heavily on Bitcoin data. As announced by alternative.me in mid-2023, plans are underway to incorporate Ethereum and Solana metrics more deeply, but for now, BTC still drives the needle.

Reading the Numbers: What Do They Mean?
Getting the number is easy. Interpreting it correctly is where the skill comes in. Most beginners make the mistake of thinking a low number means "buy now" and a high number means "sell now." It’s not that simple.
| Score Range | Sentiment | Typical Market Behavior | Actionable Insight |
|---|---|---|---|
| 0 - 24 | Extreme Fear | Panic selling, media doom-scrolling, low liquidity | Look for undervalued assets. Consider dollar-cost averaging (DCA) into quality holdings. |
| 25 - 49 | Fear | Cautious trading, pullbacks after rallies | Monitor closely. Good time to research entry points. |
| 50 | Neutral | Stable markets, mixed signals | No urgent action needed. Stick to your long-term plan. |
| 51 - 74 | Greed | Rising prices, positive news flow | Take partial profits if you have large gains. Be cautious with new entries. |
| 75 - 100 | Extreme Greed | Euphoria, FOMO buying, leverage spikes | High risk of correction. Secure profits. Avoid chasing pumps. |
Historical data supports this approach. According to analysis by SmartAsset, periods of extreme fear (below 20) have historically been followed by positive returns over the next six months in 68% of cases. Conversely, extreme greed often precedes corrections.
Common Mistakes Investors Make
I’ve seen too many traders blow up accounts because they misunderstood this tool. Here are the biggest pitfalls to avoid:
- Treating it as a Timing Tool: The index tells you *sentiment*, not *timing*. Extreme fear can persist for weeks. Selling at 15 just to buy back at 12 is a costly error. Patience is key.
- Ignoring Fundamentals: Just because the market is fearful doesn’t mean every asset is a bargain. Always check the underlying health of the company or project you’re buying.
- Chasing Greed: When the index hits 90, it feels like the market will go up forever. It rarely does. Taking profits during extreme greed is hard emotionally but smart financially.
- Using Only One Indicator: Never rely solely on the Fear and Greed Index. Combine it with technical analysis, fundamental research, and macroeconomic data.
For example, during the March 2020 pandemic crash, the stock index hit an all-time low of 2. Many who bought immediately faced further dips before the recovery began. Those who used it as a signal to start a gradual DCA strategy fared better than those who went all-in at once.

How to Use It in Your Strategy
So, how do you actually apply this? Here is a practical framework:
1. Set Alerts: Don’t check the index daily. It creates noise. Set alerts for when it drops below 20 or rises above 80. These are the actionable zones.
2. Adjust Position Sizing: In extreme fear, consider increasing your allocation to cash-flow-positive assets or blue-chip stocks. In extreme greed, reduce exposure to speculative assets.
3. Confirm with Other Data: Look at the VIX for stocks or on-chain data for crypto. If both align with the Fear and Greed reading, the signal is stronger.
4. Stay Contrarian: Remember Warren Buffett’s advice: "Be fearful when others are greedy, and greedy when others are fearful." The index quantifies "others." Use it to check your own biases.
Limitations and Criticisms
No tool is perfect. Critics, including Nobel laureate Robert Shiller, point out that sentiment indicators capture temporary emotions but ignore long-term valuation metrics. During structural market shifts-like the rise of AI stocks or the decentralization of finance-the old correlations may break down.
Additionally, the index is backward-looking. It reflects what has already happened. By the time the index shows extreme greed, the smart money may have already exited. It’s a lagging indicator disguised as a real-time gauge.
Also, be aware of the "self-fulfilling prophecy" effect. As more retail investors watch the index, their actions based on it can influence the market itself. For instance, increased buying pressure during extreme fear readings has been noted by Federal Reserve researchers, potentially softening crashes.
Conclusion: A Compass, Not a Map
The Fear and Greed Index is a valuable compass for navigating the emotional turbulence of financial markets. It won’t tell you exactly where to go, but it will warn you if you’re heading into a storm or sailing into calm waters. Use it to stay disciplined, avoid FOMO, and find courage when panic rules. But always pair it with solid research and a clear investment plan. After all, the market rewards patience and punishes emotion.
Is the Fear and Greed Index accurate?
It is highly accurate in measuring sentiment, but not in predicting exact price movements. Historical data shows strong correlations between extreme readings and subsequent market reversals, but timing varies.
Where can I find the Crypto Fear and Greed Index?
You can view the live Crypto Fear and Greed Index on alternative.me. It updates daily and provides detailed breakdowns of the four metrics used in its calculation.
Should I buy when the index is in extreme fear?
Not necessarily all at once. Extreme fear is a good time to look for opportunities, but it’s safer to dollar-cost average (DCA) over time to mitigate the risk of further declines.
Does the index work for individual stocks?
The standard CNN index tracks broad market indices like the S&P 500. For individual stocks, you need to analyze specific sentiment tools or social media buzz related to that ticker.
Why is the Crypto Index different from the Stock Index?
Cryptocurrency markets operate 24/7, are more volatile, and are heavily influenced by social media and on-chain activity. The stock index relies on traditional financial metrics like bond yields and options ratios.